Charting the chronological map of diseases for 308 physical and mental health conditions in the NHS
29 May 2019
Guest Blog - Dr Valerie Kuan Po Ai, Wellcome Trust Clinical Training Fellow, UCL

Like many at medical school I was fascinated with rare diseases. The medical curriculum encouraged this, placing more emphasis on the diagnosis and management of eponymous syndromes such as Stevens-Johnson syndrome than on mundane skin conditions such as seborrheic dermatitis. Most medical students can tell you more about the pathogenesis of Marfan syndrome than of soft tissue disorders. Common conditions just aren’t very glamorous.
Then I started training in general practice. And I began to appreciate that diagnosing and managing common conditions is more challenging than I had realised. Weighing the differential diagnoses in patients with intermittent breathlessness, managing depression and anxiety, encouraging people to lead healthier lifestyles: these are difficult tasks. Knowing how common certain conditions are could help us decide how likely a patient is to have a particular condition. And knowing which conditions are common would allow us to train doctors and nurses to recognise and manage these conditions better. And to stop them from being common. But what is common? And who gets which diseases when?
I tried to find out. I looked up papers. There was more information for some diseases than others. Often, a wide range of incidence and prevalence estimates were quoted from a variety of sources, most of which were small sample sets, or surveys that did not represent the general population.
Which made me think – if we had access to a large dataset that was representative of the general population, we could derive these estimates across different ages for a wide range of diseases. And we do. Because the NHS provides universal health care from cradle to grave for almost everyone in the UK, and the use of electronic health records (EHRs) in the NHS has been widespread (especially in primary care) for the past 20 years, we could use EHRs from the NHS to achieve this.
It was of course easier said than done. The reason no one had attempted this before was because it was arduous, eye-straining work going through the disease classification dictionaries used in primary and secondary care and creating codelists for each condition. I have to thank all my clinician co-authors for their patience and tenacity in working together to produce the codelists from the Read, ICD-10 and OPCS-4 codes that are now published on the CALIBER website. Extracting huge amounts of data from the CPRD and HES datasets was no doddle either. Credit for this goes to the CALIBER team, especially Spiros Denaxas, who led the team and set up the website and data repository for the codes and algorithms. Thanks to him, researchers can now access the phenotyping algorithms on an open platform.

But it wasn’t all tedium. It was wonderfully enjoyable working with everyone on the team. There was a sense of “let’s make this happen” and conviviality throughout. And analysing big data is fun. As with all worthy human enterprises, it involves a bit of science and a bit of art, and obtaining results and beautiful pictures from computer code is incredibly satisfying. It was also a privilege to work with Professors Aroon Hingorani and Harry Hemingway, who provided the inspiration and wisdom that gave this work its final shape.
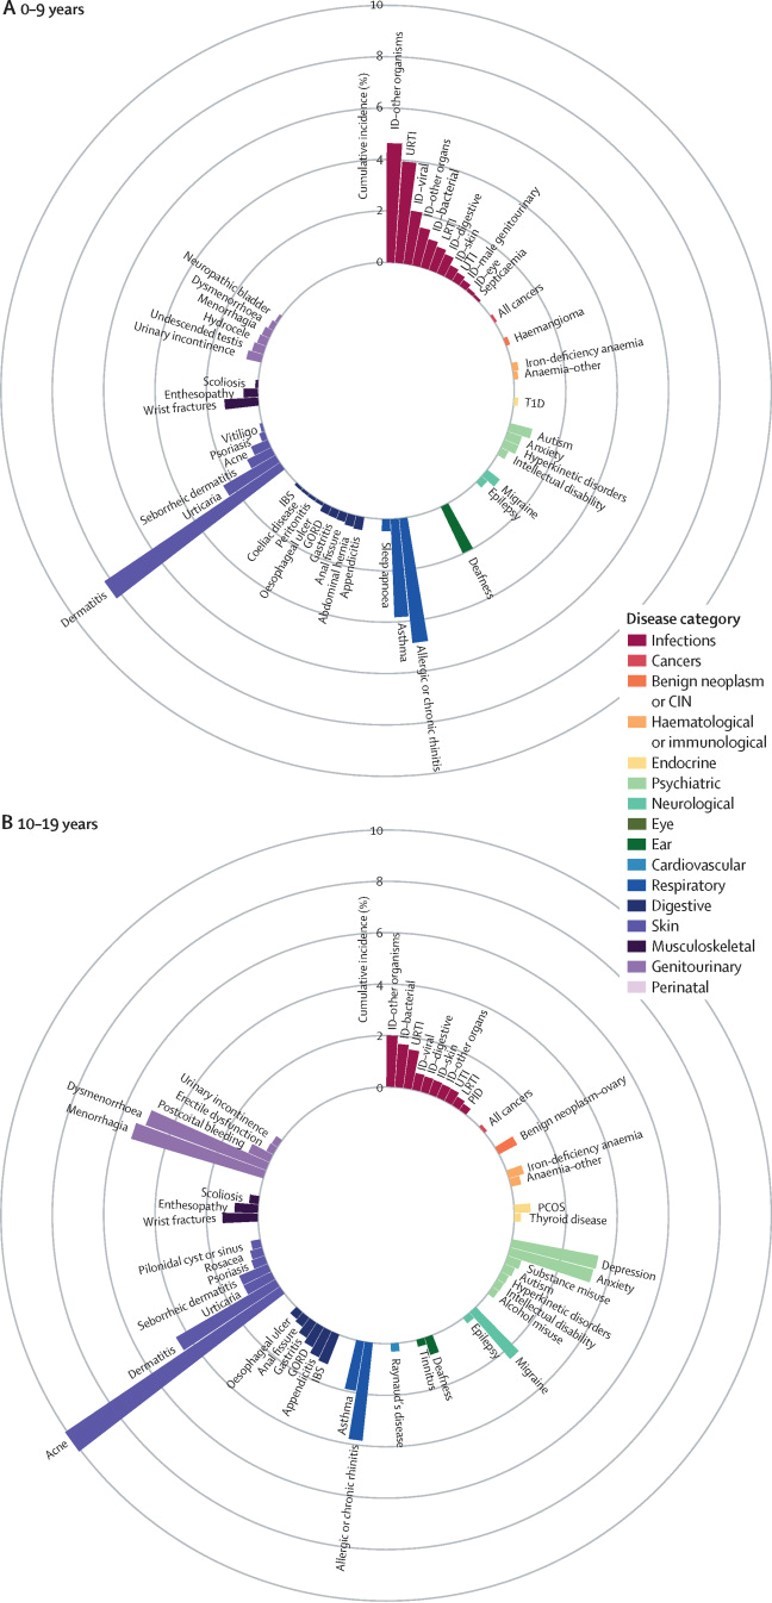
The chronological map of human diseases that we produced shows which diseases are most common at which stages of life. It also shows how disease onset differs between individuals by sex and ethnicity, and so answers my questions about who gets what when. I hope we have given readers a resource that they can apply to a myriad of uses and that ultimately, policy changes and future research from this paper will benefit patients, who are the reason for all medical research.
Reference: A chronological map of 308 physical and mental health conditions from 4 million individuals in the English National Health Service. Kuan, Valerie et al. The Lancet Digital Health , Volume 1 , Issue 2 , e63 – e77. DOI:https://doi.org/10.1016/S2589-7500(19)30012-3


